You probably don’t need a fancy blue and white chart with weird numbers on it to tell you it would be a good idea to try to imitate what Copenhagen, Berlin, Minsk, Helsinki and Belfast have been doing in the EURO League.
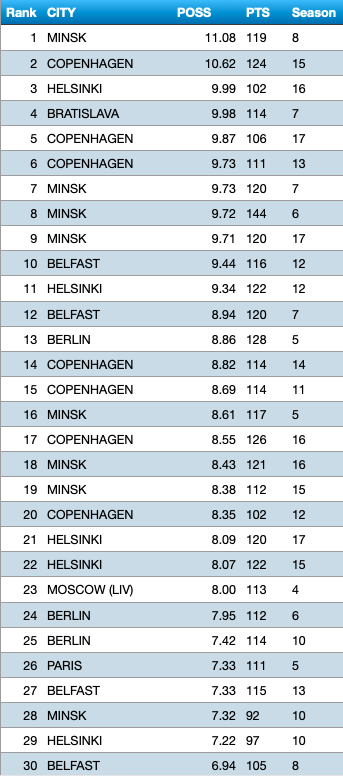
But to reinforce that unscientific reaction, look what you see when you compare shots per game totals and shots allowed per game totals, and then you calculate the difference between them. You see those five city names over and over again at the top of a sorted list. And that list is what we see on this page. The third column tells you the difference on average that the team had that year. For example, at the very bottom, you will see Belfast took almost 7 shots more per game than they allowed.
NEWSFLASH: You want more shots on their goalie than they take on your goalie. That gives you a better chance of winning. It usually means you are possessing the puck more and it’s a decent indicator that everyone on the team is doing their job.
Look at what Minsk did in Seasons 6, 7 and 8, a period when they won the Cup twice (6 and 8). In Season 6, they put together the best points season in EURO history with 144 points and part of that success was the fact they took 9.72 more shots than they allowed per game. It’s tough to beat that. But they did. The next year, they took 9.73 more shots than they allowed. But Belfast and Hall of Fame goalie Jonathan Quick won the Cup that year. Minsk then bounced back with the top season of all time on the Shots Differential chart. They took 11.08 more shots per game than they allowed and they carried the Cup around for the second time. In those days, Patrick Kane and Milan Lucic were terrorizing from the wings while Nicklas Backstrom and Jordan Staal whirled around at the center position and the amazing defense corps led by Maxim Chudinov, Michael Del Zotto and Ryan McDonough was doing fantastic work at both ends of the rink.
In more recent years, Copenhagen has put together monster teams if the Shots Differential statistic can be used as an indicator. One-third of the 15 best Shot Differential seasons have the name Copenhagen attached to them and all of those seasons have been from Season 11 on. The Tridents won two EURO Cups in that period.
Helsinki also won two Cups since Season 11 and you won’t be surprised to learn those two seasons show up on the chart at Numbers 21 and 22. In between those seasons, the Jokerit had a much better Shots Differential with 9.99 more shots per game than shots allowed (No. 3 on the chart), but they didn’t win the Cup that year. That tells you goalies and the quality of the shooters – and probably luck – are not reflected in the formula.
And then there are the Berlin Smurfs, who once again are skating around ruining everyone’s mathematical formulas and theories. Since Season 11, the Smurfs won three EURO Cups. Want to take a guess how any times in that period they showed up on the chart? Not once. Of course. When Berlin did put together high Shot Differential seasons – in Seasons 5, 6 and 10 – they won zero Cups. Our stats analysts have officially concluded that the Smurfs are just a backwards group and it’s a waste of time to try to understand them.

